pyvista.ChartBox#
- class ChartBox(data, colors=None, labels=None, size=None, loc=None)[source]#
Dedicated chart for drawing box plots.
- Parameters:
- datasequence[array_like]
Dataset(s) from which the relevant statistics will be calculated used to draw the box plot.
- colorssequence[
ColorLike],optional Color used for each drawn boxplot. If omitted (
None), the default color scheme is used.- labelssequence[
str], default: [] Label for each drawn boxplot, as shown in the chart’s legend.
- sizesequence[
float],optional Size of the chart in normalized coordinates. A size of
(0,
0)
is invisible, a size of(1, 1)occupies the whole renderer’s width and height.- locsequence[
float],optional Location of the chart (its bottom left corner) in normalized coordinates. A location of
(0, 0)corresponds to the renderer’s bottom left corner, a location of(1, 1)corresponds to the renderer’s top right corner.
Examples
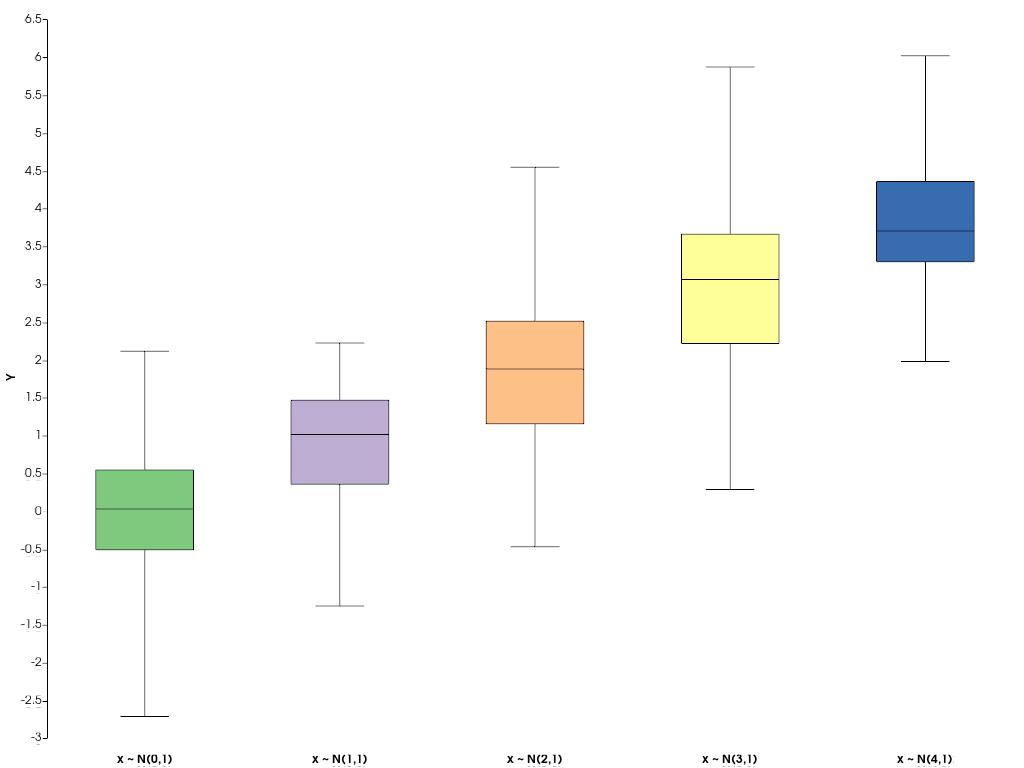
Create boxplots for datasets sampled from shifted normal distributions.
>>> import pyvista as pv
>>> import numpy as np
>>> rng = np.random.default_rng(1)  # Seeded random number generator used for data generation
>>> normal_data = [rng.normal(i, size=50) for i in range(5)]
>>> chart = pv.ChartBox(normal_data, labels=[f"x ~ N({i},1)" for i in range(5)])
>>> chart.show()

Methods
ChartBox.show([interactive, off_screen, ...])Show this chart in a self contained plotter.
Toggle the chart's visibility.
Attributes
Return or set the chart's background color in interactive mode.
Return or set the chart's border color in interactive mode.
Return or set the chart's background color.
Return or set the chart's background texture.
Return or set the chart's border color.
Return or set the chart's border style.
Return or set the chart's border width.
Return or set the visibility of the chart's legend.
Return or set the chart position in normalized coordinates.
Return the
BoxPlotinstance associated with this chart.Return or set the chart size in normalized coordinates.
Return or set the chart's title.
Return or set the chart's visibility.