pyvista.PolyDataFilters.contour_banded#
- PolyDataFilters.contour_banded(n_contours, rng=None, scalars=None, component=0, clip_tolerance=1e-06, generate_contour_edges=True, scalar_mode='value', clipping=True, progress_bar=False)[source]#
Generate filled contours.
Generates filled contours for vtkPolyData. Filled contours are bands of cells that all have the same cell scalar value, and can therefore be colored the same. The method is also referred to as filled contour generation.
This filter implements vtkBandedPolyDataContourFilter.
- Parameters:
- n_contours
int Number of contours.
- rng
Sequence,optional Range of the scalars. Optional and defaults to the minimum and maximum of the active scalars of
scalars.- scalars
str,optional The name of the scalar array to use for contouring. If
None, the active scalar array will be used.- component
int, default: 0 The component to use of an input scalars array with more than one component.
- clip_tolerance
float, default: 1e-6 Set/Get the clip tolerance. Warning: setting this too large will certainly cause numerical issues. Change from the default value at your own risk. The actual internal clip tolerance is computed by multiplying
clip_toleranceby the scalar range.- generate_contour_edgesbool, default:
True Controls whether contour edges are generated. Contour edges are the edges between bands. If enabled, they are generated from polygons/triangle strips and returned as a second output.
- scalar_mode
str, default: ‘value’ Control whether the cell scalars are output as an integer index or a scalar value. If
'index', the index refers to the bands produced by the clipping range. If'value', then a scalar value which is a value between clip values is used.- clippingbool, default:
True Indicate whether to clip outside
rngand only return cells with values withinrng.- progress_barbool, default:
False Display a progress bar to indicate progress.
- n_contours
- Returns:
- output
pyvista.PolyData Surface containing the contour surface.
- edges
pyvista.PolyData Optional edges when
generate_contour_edgesisTrue.
- output
Examples
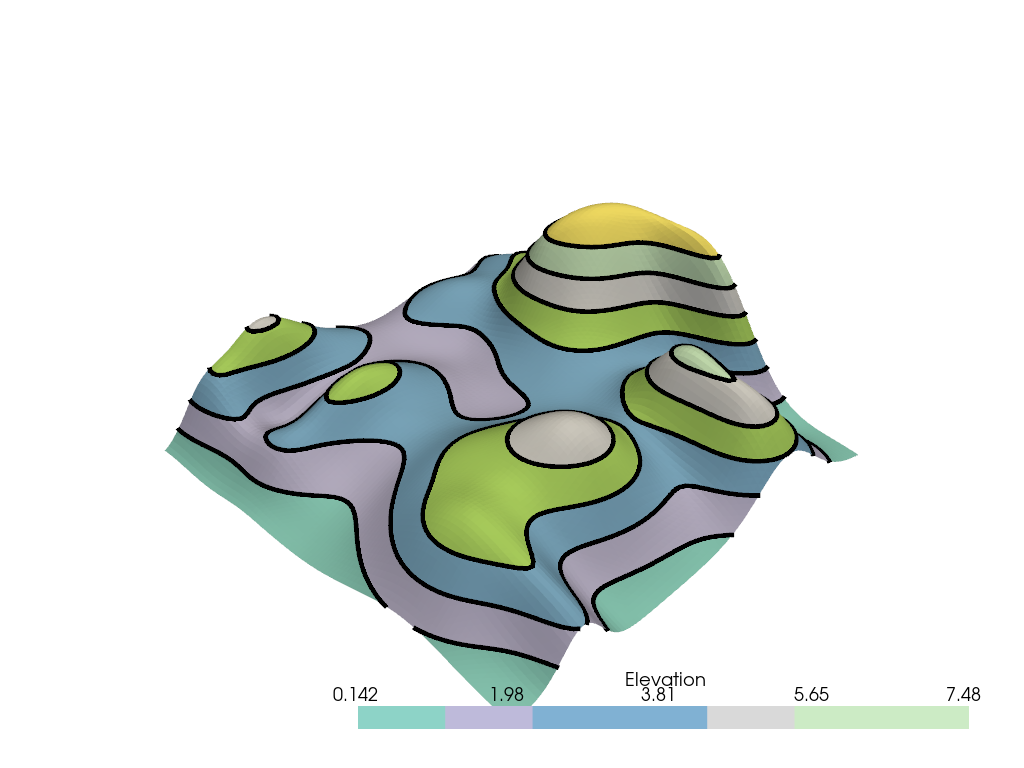
Plot the random hills dataset and with 8 contour lines. Note how we use 7 colors here (
n_contours - 1).>>> import pyvista as pv >>> from pyvista import examples
>>> mesh = examples.load_random_hills()
>>> n_contours = 8
>>> _, edges = mesh.contour_banded(n_contours)
>>> pl = pv.Plotter()
>>> _ = pl.add_mesh(
...     edges,
...     line_width=5,
...     render_lines_as_tubes=True,
...     color='k',
... )
>>> _ = pl.add_mesh(mesh, n_colors=n_contours - 1, cmap='Set3')
>>> pl.show()
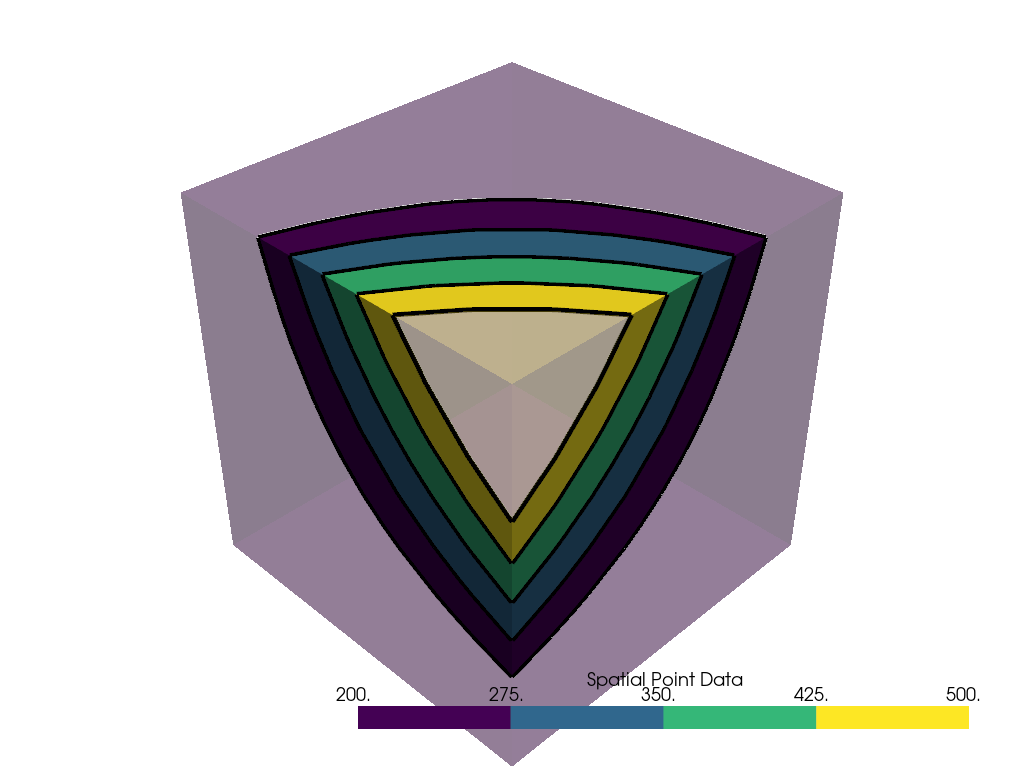
Extract the surface from the uniform grid dataset and plot its contours alongside the output from the banded contour filter.
>>> surf = examples.load_uniform().extract_surface()
>>> n_contours = 5
>>> rng = [200, 500]
>>> output, edges = surf.contour_banded(n_contours, rng=rng)
>>> dargs = dict(n_colors=n_contours - 1, clim=rng)
>>> pl = pv.Plotter()
>>> _ = pl.add_mesh(
...     edges,
...     line_width=5,
...     render_lines_as_tubes=True,
...     color='k',
... )
>>> _ = pl.add_mesh(surf, opacity=0.3, **dargs)
>>> _ = pl.add_mesh(output, **dargs)
>>> pl.show()