Note
Go to the end to download the full example code
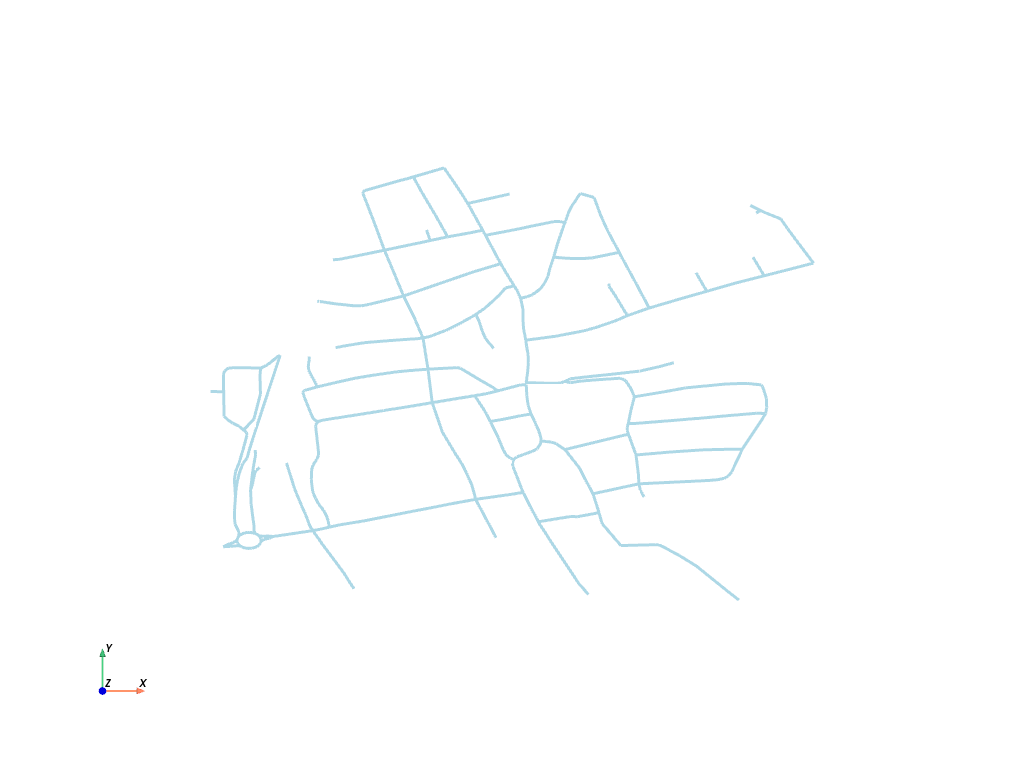
Plot Open Street Map Data#
This was originally posted to pyvista/pyvista-support#486.
Be sure to check out osmnx
Start by generating a graph from an address.
import numpy as np
import osmnx as ox

import pyvista as pv

# Alternatively, use the pickeled graph included in our examples.
from pyvista import examples
Read in the graph directly from the Open Street Map server.
# address = 'Holzgerlingen DE'
# graph = ox.graph_from_address(address, dist=500, network_type='drive')
# pickle.dump(graph, open('/tmp/tmp.p', 'wb'))

graph = examples.download_osmnx_graph()
/home/runner/work/pyvista/pyvista/pyvista/examples/downloads.py:3932: UserWarning: Unpickling a shapely <2.0 geometry object. Please save the pickle again; shapely 2.1 will not have this compatibility.
  return pickle.load(open(filename, 'rb'))
Next, convert the edges into pyvista lines using
pyvista.lines_from_points().
Finally, merge the lines and plot

Total running time of the script: (0 minutes 0.492 seconds)