pyvista.DataSetFilters.sample_over_circular_arc_normal#
- DataSetFilters.sample_over_circular_arc_normal(center, resolution=None, normal=None, polar=None, angle=None, tolerance=None, progress_bar=False)[source]#
Sample a dataset over a circular arc defined by a normal and polar vector and plot it.
The number of segments composing the polyline is controlled by setting the object resolution.
- Parameters:
- centersequence[
float] Location in
[x, y, z].- resolution
int,optional Number of pieces to divide circular arc into. Defaults to number of cells in the input mesh. Must be a positive integer.
- normalsequence[
float],optional The normal vector to the plane of the arc. By default it points in the positive Z direction.
- polarsequence[
float],optional Starting point of the arc in polar coordinates. By default it is the unit vector in the positive x direction.
- angle
float,optional Arc length (in degrees), beginning at the polar vector. The direction is counterclockwise. By default it is 360.
- tolerance
float,optional Tolerance used to compute whether a point in the source is in a cell of the input. If not given, tolerance is automatically generated.
- progress_barbool, default:
False Display a progress bar to indicate progress.
- centersequence[
- Returns:
pyvista.PolyDataSampled Dataset.
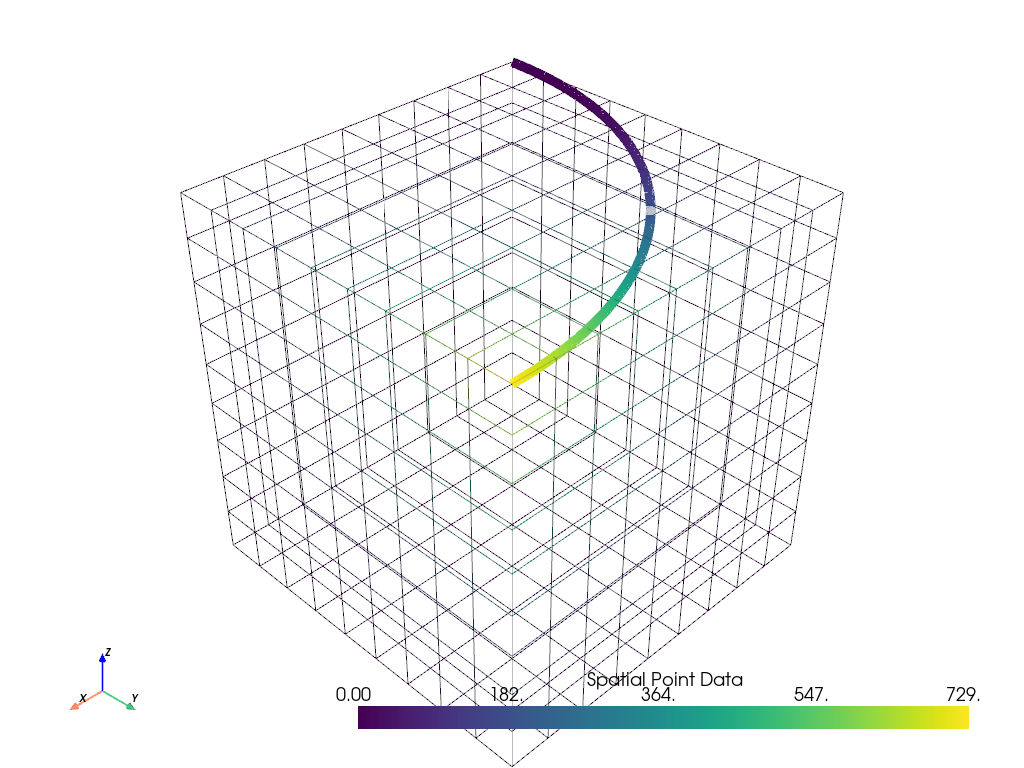
Examples
Sample a dataset over a circular arc.
>>> import pyvista as pv
>>> from pyvista import examples
>>> uniform = examples.load_uniform()
>>> uniform["height"] = uniform.points[:, 2]
>>> normal = [0, 0, 1]
>>> polar = [0, 9, 0]
>>> center = [
...     uniform.bounds[1],
...     uniform.bounds[2],
...     uniform.bounds[5],
... ]
>>> arc = uniform.sample_over_circular_arc_normal(
...     center, normal=normal, polar=polar
... )
>>> pl = pv.Plotter()
>>> _ = pl.add_mesh(uniform, style='wireframe')
>>> _ = pl.add_mesh(arc, line_width=10)
>>> pl.show_axes()
>>> pl.show()