pyvista.Plotter.add_scalar_bar#
- Plotter.add_scalar_bar(title='', mapper=None, n_labels=5, italic=False, bold=False, title_font_size=None, label_font_size=None, color=None, font_family=None, shadow=False, width=None, height=None, position_x=None, position_y=None, vertical=None, interactive=None, fmt=None, use_opacity=True, outline=False, nan_annotation=False, below_label=None, above_label=None, background_color=None, n_colors=None, fill=False, render=False, theme=None)[source]#
Create scalar bar using the ranges as set by the last input mesh.
- Parameters:
- title
str, default: “” Title of the scalar bar. Default is rendered as an empty title.
- mapper
vtkMapper,optional Mapper used for the scalar bar. Defaults to the last mapper created by the plotter.
- n_labels
int, default: 5 Number of labels to use for the scalar bar.
- italicbool, default:
False Italicises title and bar labels.
- boldbool, default:
False Bolds title and bar labels.
- title_font_size
float,optional Sets the size of the title font. Defaults to
Noneand is sized according topyvista.plotting.themes.Theme.font.- label_font_size
float,optional Sets the size of the title font. Defaults to
Noneand is sized according topyvista.plotting.themes.Theme.font.- color
ColorLike,optional Either a string, rgb list, or hex color string. Default set by
pyvista.plotting.themes.Theme.font. Can be in one of the following formats:color='white'color='w'color=[1.0, 1.0, 1.0]color='#FFFFFF'
- font_family{‘courier’, ‘times’, ‘arial’}
Font family. Default is set by
pyvista.plotting.themes.Theme.font.- shadowbool, default:
False Adds a black shadow to the text.
- width
float,optional The percentage (0 to 1) width of the window for the colorbar. Default set by
pyvista.plotting.themes.Theme.colorbar_verticalorpyvista.plotting.themes.Theme.colorbar_horizontaldepending on the value ofvertical.- height
float,optional The percentage (0 to 1) height of the window for the colorbar. Default set by
pyvista.plotting.themes.Theme.colorbar_verticalorpyvista.plotting.themes.Theme.colorbar_horizontaldepending on the value ofvertical.- position_x
float,optional The percentage (0 to 1) along the windows’s horizontal direction to place the bottom left corner of the colorbar. Default set by
pyvista.plotting.themes.Theme.colorbar_verticalorpyvista.plotting.themes.Theme.colorbar_horizontaldepending on the value ofvertical.- position_y
float,optional The percentage (0 to 1) along the windows’s vertical direction to place the bottom left corner of the colorbar. Default set by
pyvista.plotting.themes.Theme.colorbar_verticalorpyvista.plotting.themes.Theme.colorbar_horizontaldepending on the value ofvertical.- verticalbool,
optional Use vertical or horizontal scalar bar. Default set by
pyvista.plotting.themes.Theme.colorbar_orientation.- interactivebool,
optional Use a widget to control the size and location of the scalar bar. Default set by
pyvista.plotting.themes.Theme.interactive.- fmt
str,optional printfformat for labels. Default set bypyvista.plotting.themes.Theme.font.- use_opacitybool, default:
True Optionally display the opacity mapping on the scalar bar.
- outlinebool, default:
False Optionally outline the scalar bar to make opacity mappings more obvious.
- nan_annotationbool, default:
False Annotate the NaN color.
- below_label
str,optional String annotation for values below the scalars range.
- above_label
str,optional String annotation for values above the scalars range.
- background_color
ColorLike,optional The color used for the background in RGB format.
- n_colors
int,optional The maximum number of color displayed in the scalar bar.
- fillbool, default:
False Draw a filled box behind the scalar bar with the
background_color.- renderbool, default:
False Force a render when True.
- theme
pyvista.plotting.themes.Theme,optional Plot-specific theme. By default, calling from the
Plotter, will use the plotter theme. Setting toNonewill use the global theme.
- title
- Returns:
vtk.vtkScalarBarActorScalar bar actor.
Notes
Setting
title_font_size, orlabel_font_sizedisables automatic font sizing for both the title and label.Examples
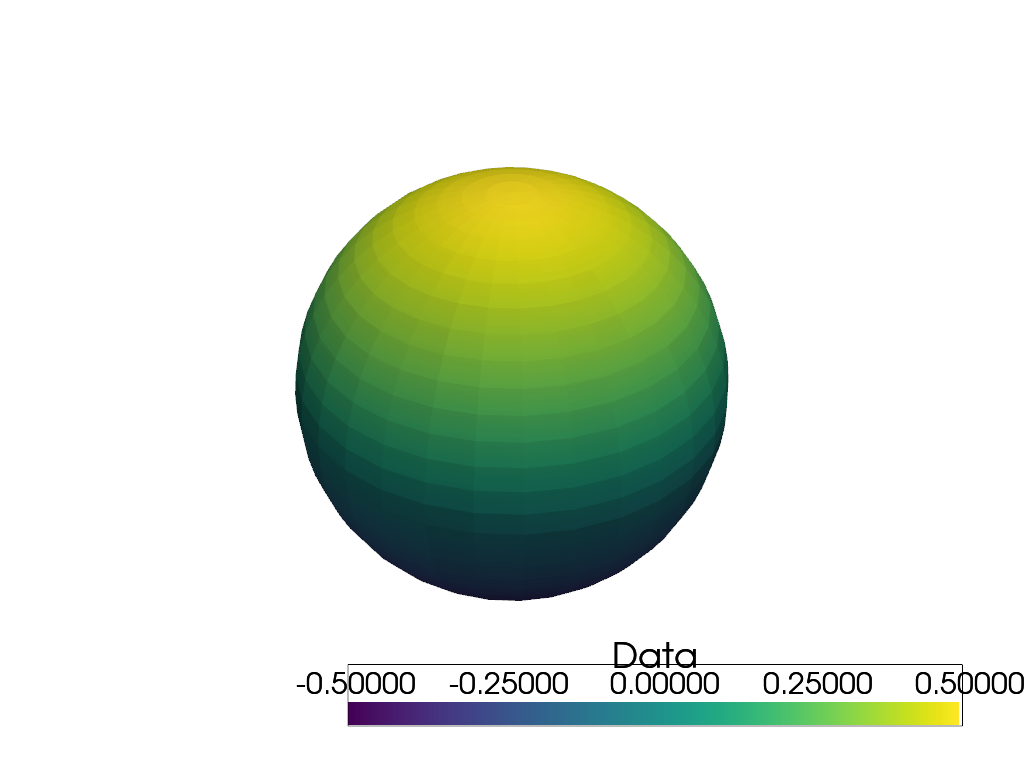
Add a custom interactive scalar bar that is horizontal, has an outline, and has a custom formatting.
>>> import pyvista as pv
>>> sphere = pv.Sphere()
>>> sphere['Data'] = sphere.points[:, 2]
>>> plotter = pv.Plotter()
>>> _ = plotter.add_mesh(sphere, show_scalar_bar=False)
>>> _ = plotter.add_scalar_bar(
...     'Data',
...     interactive=True,
...     vertical=False,
...     title_font_size=35,
...     label_font_size=30,
...     outline=True,
...     fmt='%10.5f',
... )
>>> plotter.show()