Note
Go to the end to download the full example code
Plotting Bounds#
This example demonstrates to show bounds within a pyvista.Plotter
using show_grid()
import pyvista as pv
from pyvista import examples
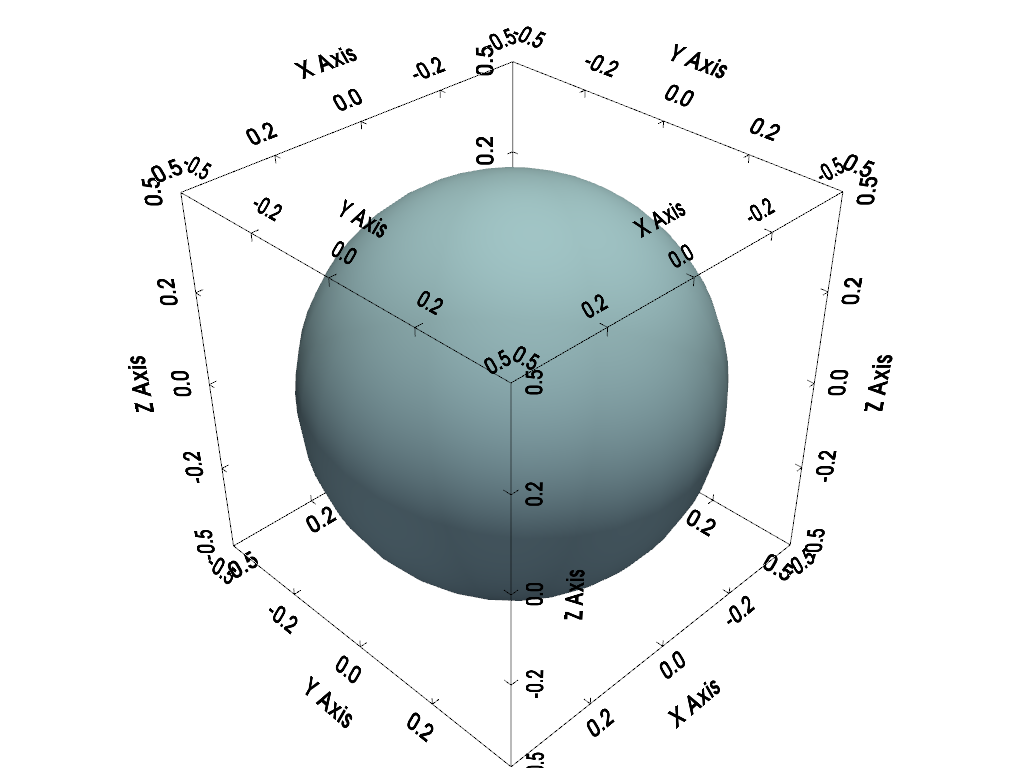
Show All Bounds#
In this plot we show the bounds for all axes by setting location='all'.
plotter = pv.Plotter()
plotter.add_mesh(pv.Sphere(), smooth_shading=True)
plotter.show_bounds(location='all')
plotter.show()

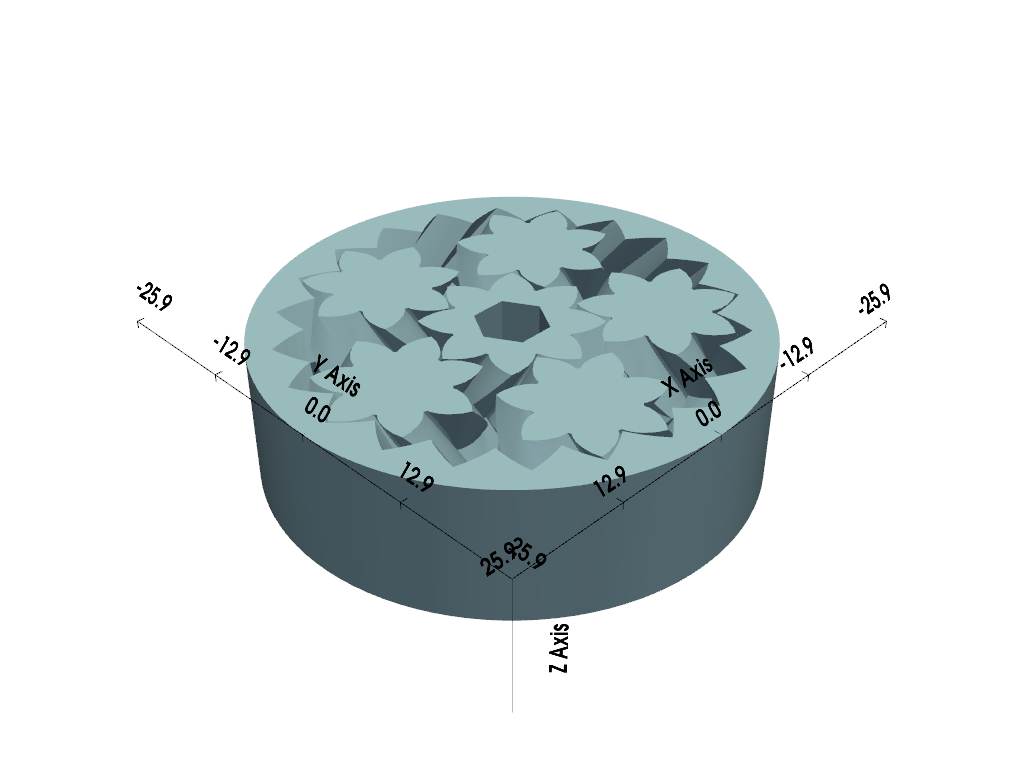
Override Shown Values Limits#
In this example, we override the values shown along the X and Y axes with our
own custom values. This can be useful when you wish to display different
values along the axes without having to scale the dataset. Also, note how we
hide the Z labels by setting show_zlabels=False.
gears = examples.download_gears()

plotter = pv.Plotter()
plotter.add_mesh(gears, smooth_shading=True, split_sharp_edges=True)
plotter.show_bounds(axes_ranges=[0, 5, 0, 5, 0, 2], show_zlabels=False)
plotter.show()

print(f'Actual dataset bounds: {gears.bounds}')

Actual dataset bounds: (-25.850000381469727, 25.850000381469727, -25.850000381469727, 25.850000381469727, 0.0, 15.0)
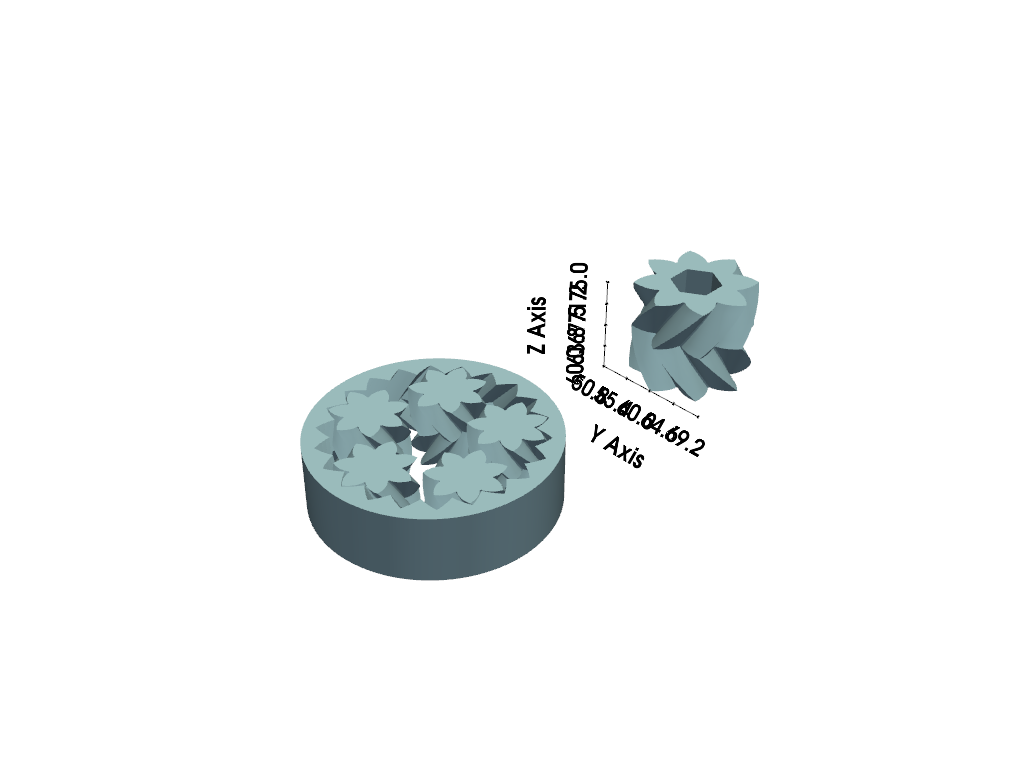
Show Bounds for Only One Dataset#
This example shows only the bounds for a single dataset. Again we use
axes_ranges here since in this example we want to show the size of the
single central gear.
# separate and shift the central gear
split_gears = gears.split_bodies()
central_gear = split_gears.pop(1)
central_gear.translate([0, 60, 60], inplace=True)

# also, grab the size of the central gear
x_size = central_gear.bounds[1] - central_gear.bounds[0]
y_size = central_gear.bounds[3] - central_gear.bounds[2]
z_size = central_gear.bounds[5] - central_gear.bounds[4]

plotter = pv.Plotter()
plotter.add_mesh(split_gears, smooth_shading=True, split_sharp_edges=True)
plotter.add_mesh(central_gear, smooth_shading=True, split_sharp_edges=True)
plotter.show_grid(
    mesh=central_gear,
    axes_ranges=[0, x_size, 0, y_size, 0, z_size],
    show_xaxis=False,
    bold=True,
    grid=False,
)
plotter.show()

Total running time of the script: (0 minutes 1.515 seconds)