Note
Go to the end to download the full example code
Moving Isovalue#
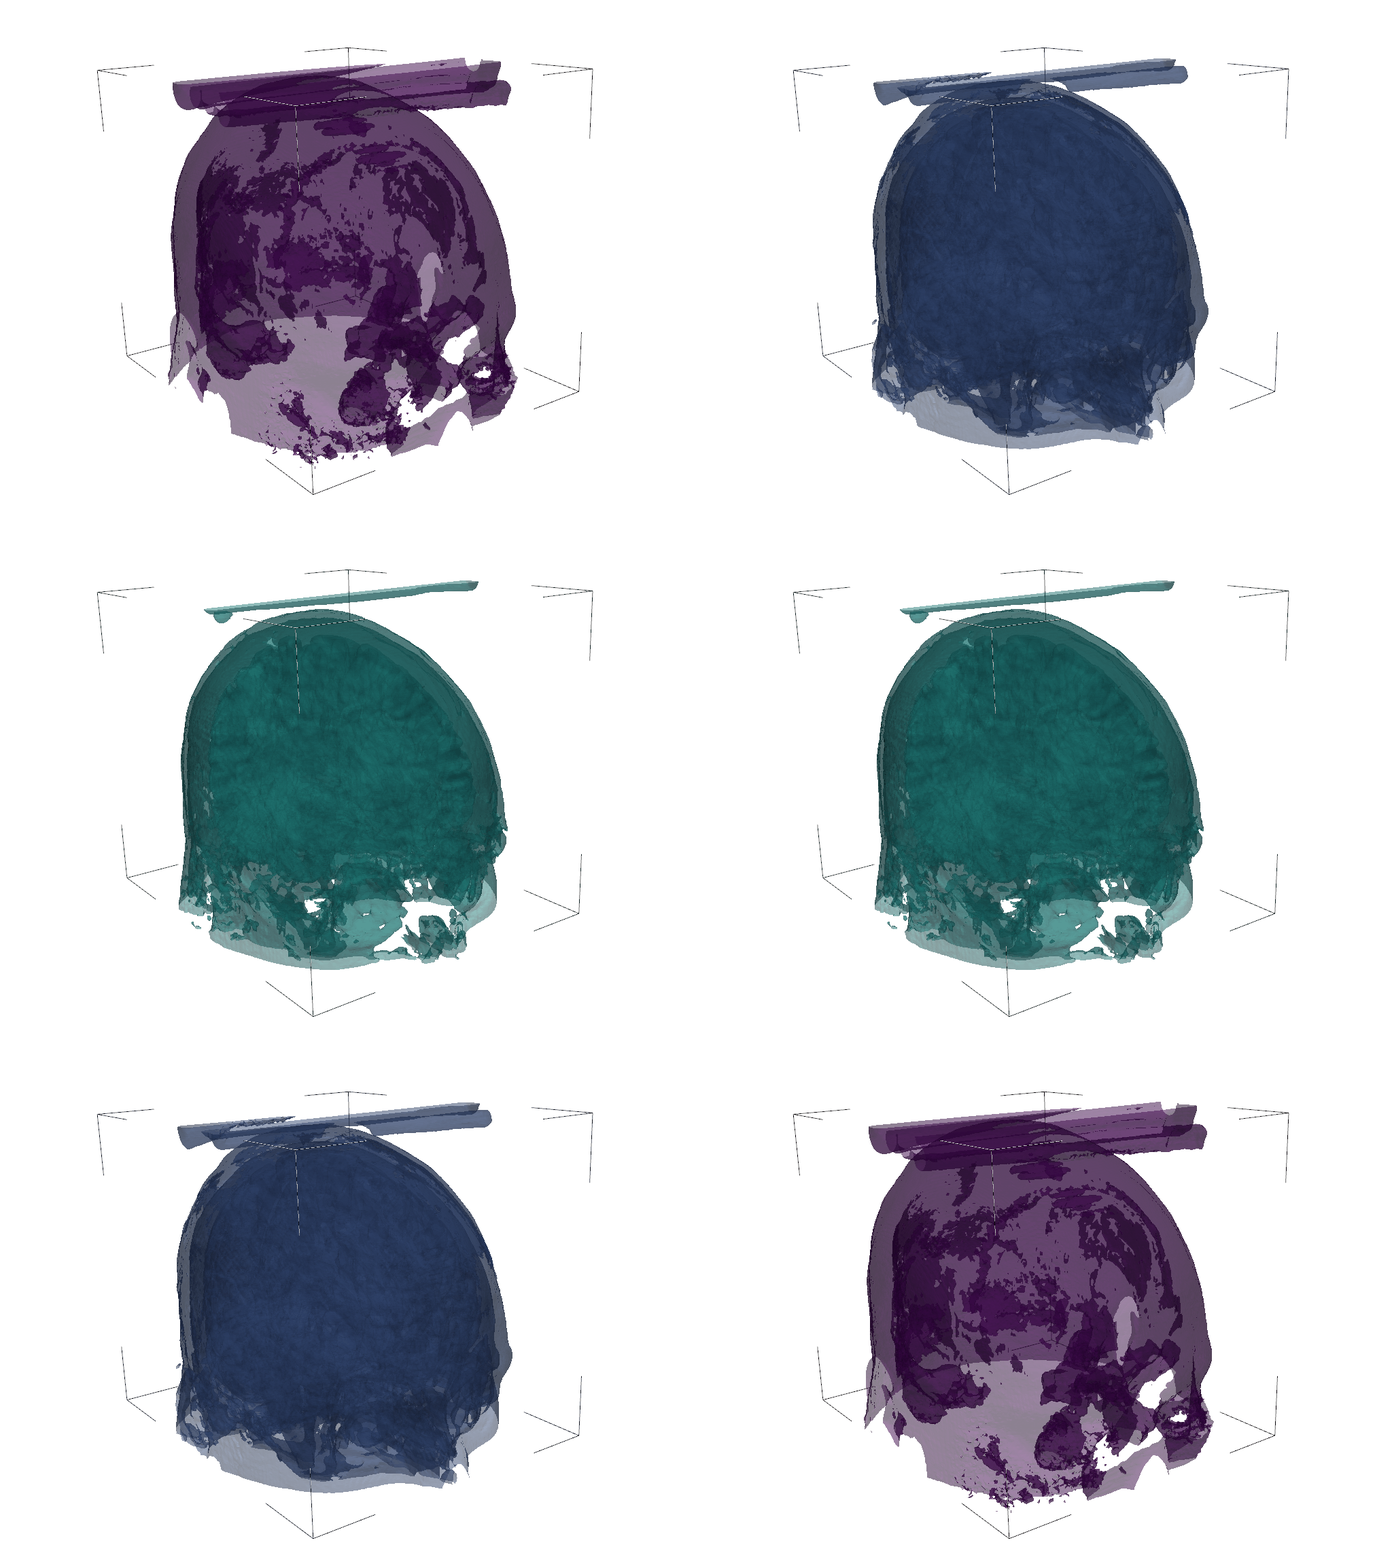
Make an animation of an isovalue through a volumetric dataset
import numpy as np

import pyvista as pv
from pyvista import examples

vol = examples.download_brain()
vol
Now lets make an array of all of the isovalues for which we want to show.
values = np.linspace(5, 150, num=25)
Now let’s create an initial isosurface that we can plot and move
surface = vol.contour(values[:1])
Precompute the surfaces
Set a single surface as the one being plotted that can be overwritten
surface = surfaces[0].copy()
filename = "isovalue.gif"

plotter = pv.Plotter(off_screen=True)
# Open a movie file
plotter.open_gif(filename)

# Add initial mesh
plotter.add_mesh(
    surface,
    opacity=0.5,
    clim=vol.get_data_range(),
    show_scalar_bar=False,
)
# Add outline for reference
plotter.add_mesh(vol.outline_corners(), color='k')

print('Orient the view, then press "q" to close window and produce movie')
plotter.camera_position = [
    (392.9783280407326, 556.4341372317185, 235.51220650196404),
    (88.69563012828344, 119.06774369173661, 72.61750326143748),
    (-0.19275936948097383, -0.2218876327549124, 0.9558293278131397),
]

# initial render and do NOT close
plotter.show(auto_close=False)

# Run through each frame
for surf in surfaces:
    surface.copy_from(surf)
    plotter.write_frame()  # Write this frame
# Run through backwards
for surf in surfaces[::-1]:
    surface.copy_from(surf)
    plotter.write_frame()  # Write this frame

# Be sure to close the plotter when finished
plotter.close()

Orient the view, then press "q" to close window and produce movie
Total running time of the script: (0 minutes 26.215 seconds)