Note
Go to the end to download the full example code
Clipping with Planes & Boxes#
Clip/cut any dataset using planes or boxes.
import pyvista as pv
from pyvista import examples
Clip with Plane#
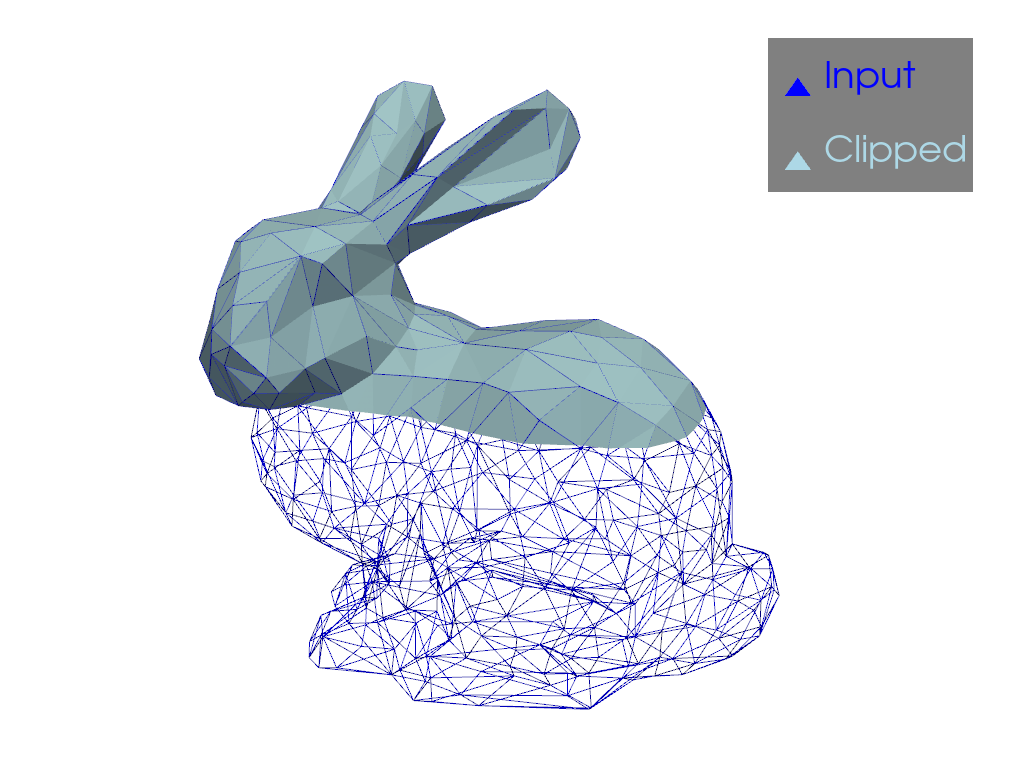
Clip any dataset by a user defined plane using the
pyvista.DataSetFilters.clip() filter
dataset = examples.download_bunny_coarse()
clipped = dataset.clip('y', invert=False)

p = pv.Plotter()
p.add_mesh(dataset, style='wireframe', color='blue', label='Input')
p.add_mesh(clipped, label='Clipped')
p.add_legend()
p.camera_position = [(0.24, 0.32, 0.7), (0.02, 0.03, -0.02), (-0.12, 0.93, -0.34)]
p.show()
Clip with Bounds#
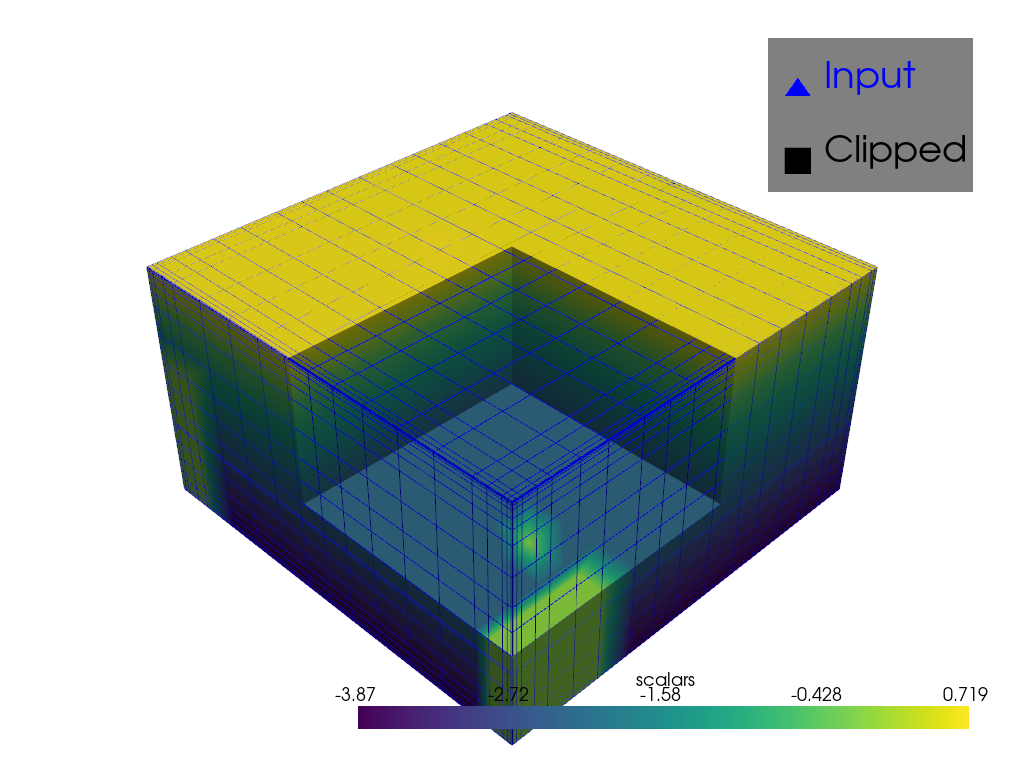
Clip any dataset by a set of XYZ bounds using the
pyvista.DataSetFilters.clip_box() filter.
Clip with Rotated Box#
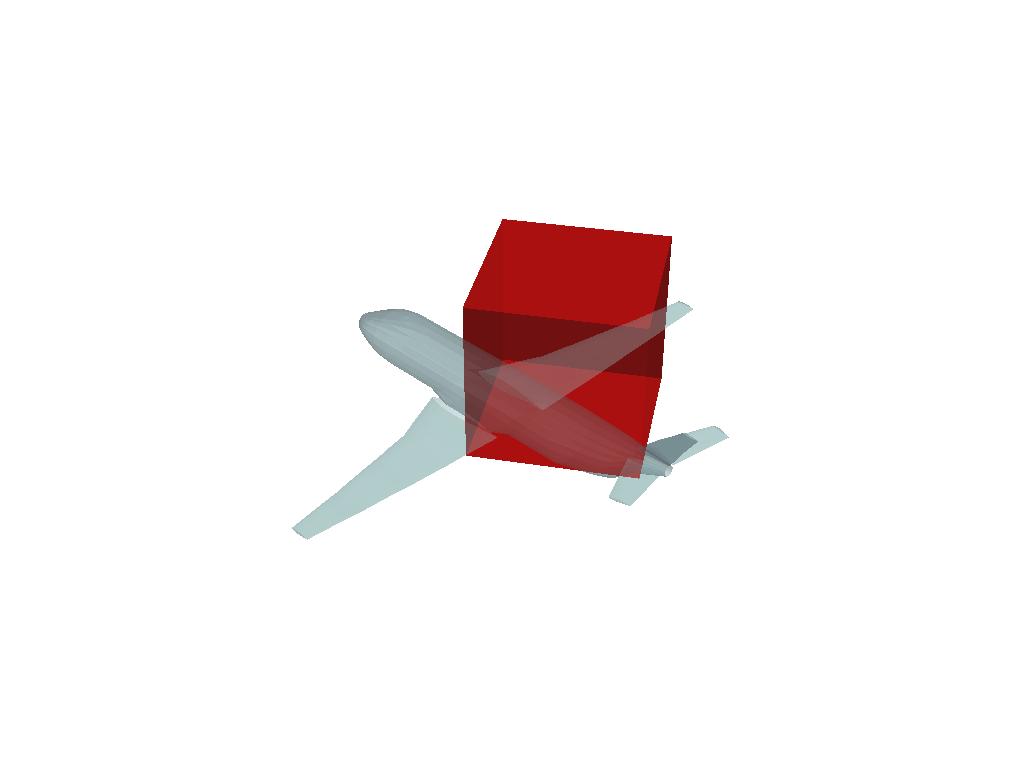
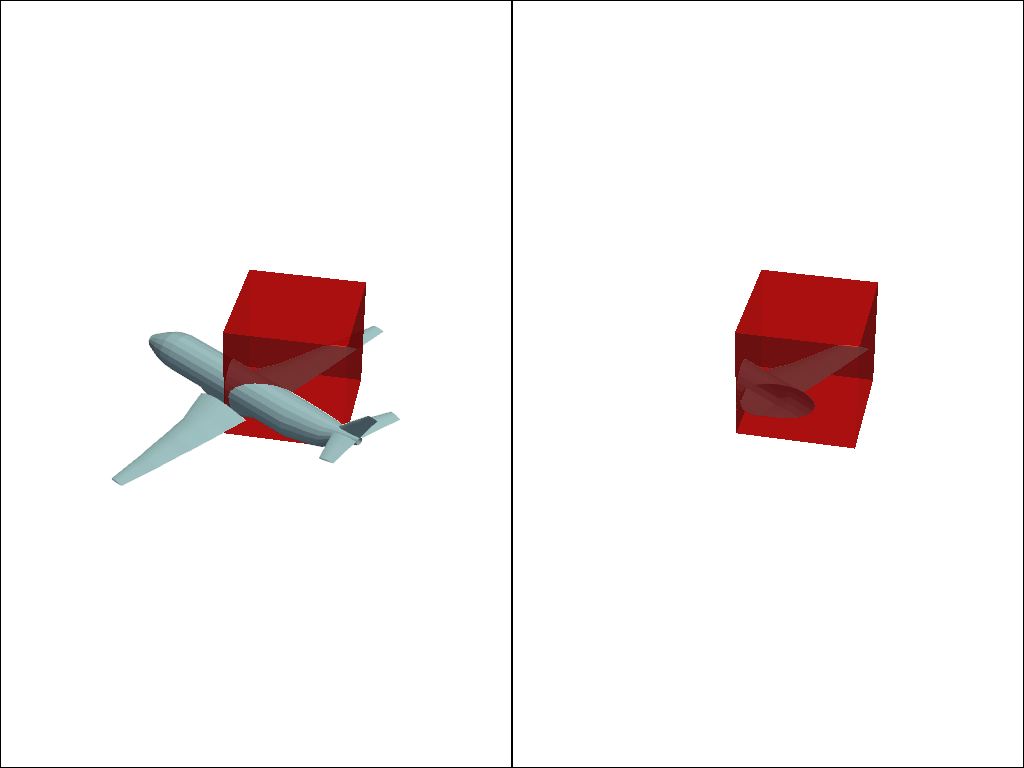
Clip any dataset by an arbitrarily rotated solid box using the
pyvista.DataSetFilters.clip_box() filter.
mesh = examples.load_airplane()

# Use `pv.Box()` or `pv.Cube()` to create a region of interest
roi = pv.Cube(center=(0.9e3, 0.2e3, mesh.center[2]), x_length=500, y_length=500, z_length=500)
roi.rotate_z(33, inplace=True)

p = pv.Plotter()
p.add_mesh(roi, opacity=0.75, color="red")
p.add_mesh(mesh, opacity=0.5)
p.show()
Run the box clipping algorithm
extracted = mesh.clip_box(roi, invert=False)

p = pv.Plotter(shape=(1, 2))
p.add_mesh(roi, opacity=0.75, color="red")
p.add_mesh(mesh)
p.subplot(0, 1)
p.add_mesh(extracted)
p.add_mesh(roi, opacity=0.75, color="red")
p.link_views()
p.view_isometric()
p.show()
Crinkled Clipping#
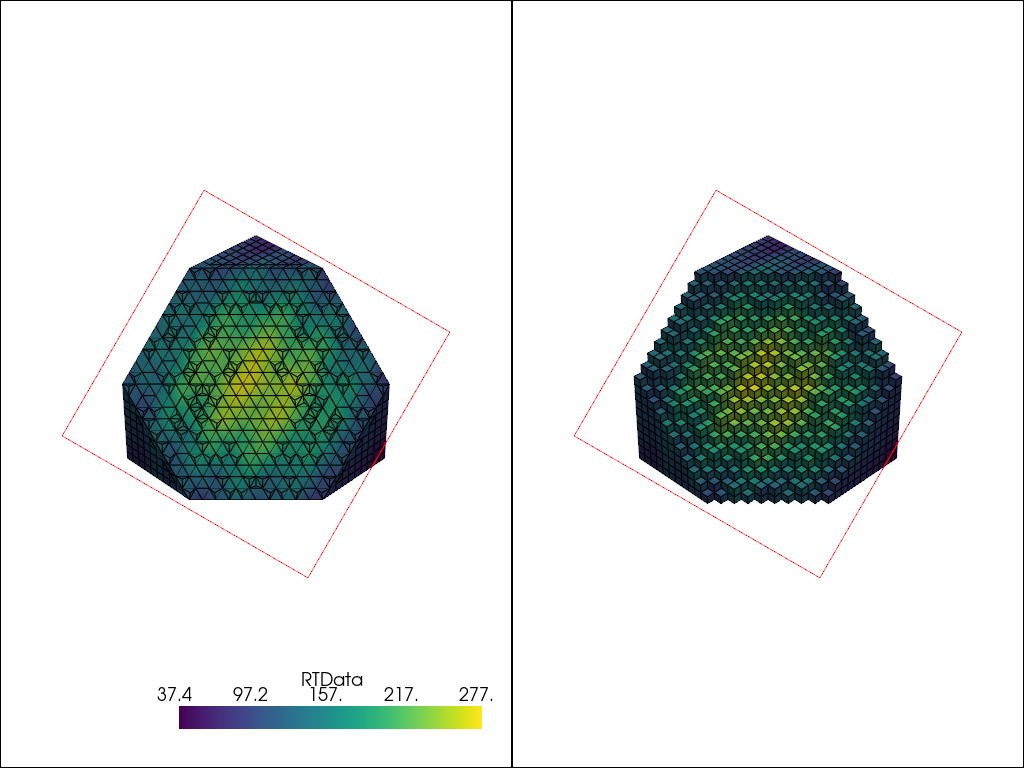
Crinkled clipping is useful if you don’t want the clip filter to truly clip cells on the boundary, but want to preserve the input cell structure and to pass the entire cell on through the boundary.
This option is available for pyvista.DataSetFilters.clip(),
pyvista.DataSetFilters.clip_box(), and
pyvista.DataSetFilters.clip_surface(), but not available when clipping
by scalar in pyvista.DataSetFilters.clip_scalar().
# Input mesh
mesh = pv.Wavelet()
Define clipping plane
Perform a standard clip
Perform a crinkled clip
Plot comparison
p = pv.Plotter(shape=(1, 2))
p.add_mesh(clipped, show_edges=True)
p.add_mesh(plane.extract_feature_edges(), color='r')
p.subplot(0, 1)
p.add_mesh(crinkled, show_edges=True)
p.add_mesh(plane.extract_feature_edges(), color='r')
p.link_views()
p.show()
Total running time of the script: (0 minutes 2.078 seconds)