Note
Go to the end to download the full example code
Marching Cubes#
Generate a surface from a scalar field using the flying edges and
marching cubes filters as provided by the contour filter.
Special thanks to GitHub user stla for providing examples.
import numpy as np

import pyvista as pv
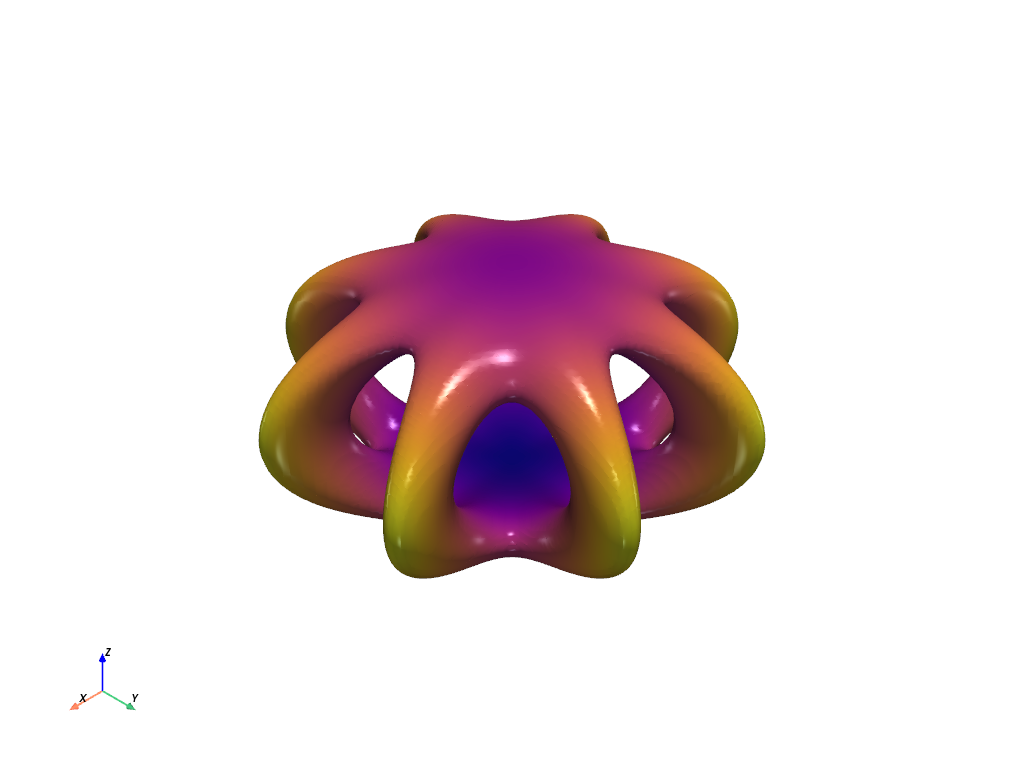
Spider Cage#
Use the marching cubes algorithm to extract the isosurface generated from the spider cage function.
a = 0.9


def spider_cage(x, y, z):
    x2 = x * x
    y2 = y * y
    x2_y2 = x2 + y2
    return (np.sqrt((x2 - y2) ** 2 / x2_y2 + 3 * (z * np.sin(a)) ** 2) - 3) ** 2 + 6 * (
        np.sqrt((x * y) ** 2 / x2_y2 + (z * np.cos(a)) ** 2) - 1.5
    ) ** 2


# create a uniform grid to sample the function with
n = 100
x_min, y_min, z_min = -5, -5, -3
grid = pv.ImageData(
    dimensions=(n, n, n),
    spacing=(abs(x_min) / n * 2, abs(y_min) / n * 2, abs(z_min) / n * 2),
    origin=(x_min, y_min, z_min),
)
x, y, z = grid.points.T

# sample and plot
values = spider_cage(x, y, z)
mesh = grid.contour([1], values, method='marching_cubes')
dist = np.linalg.norm(mesh.points, axis=1)
mesh.plot(scalars=dist, smooth_shading=True, specular=1, cmap="plasma", show_scalar_bar=False)

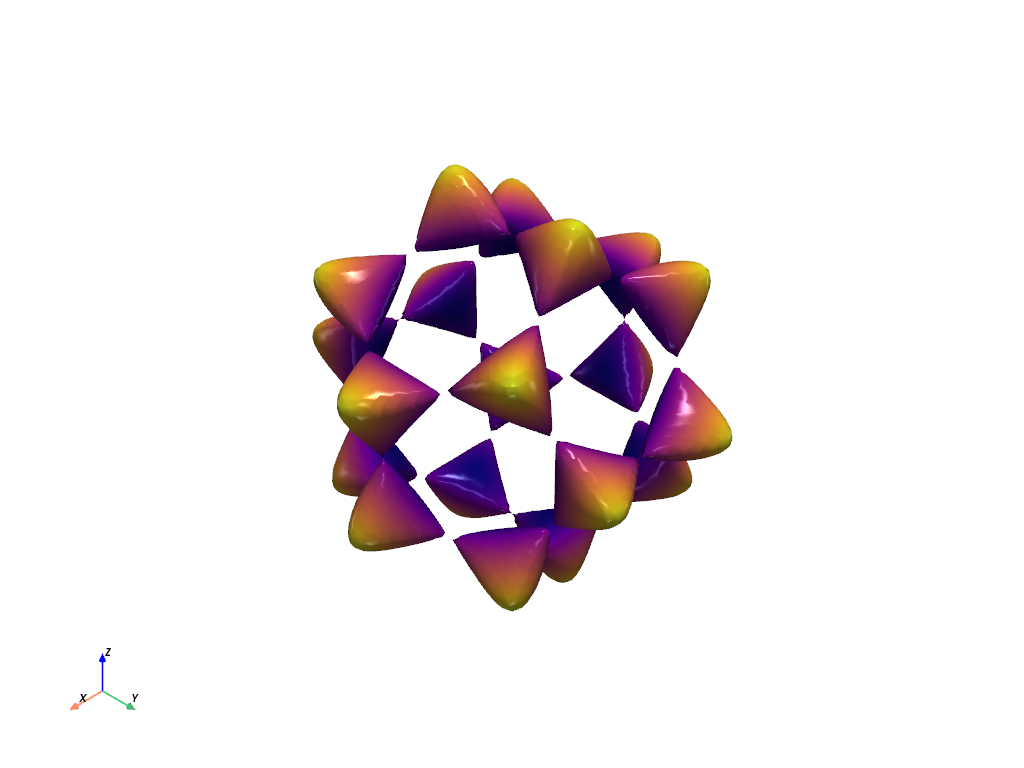
Barth Sextic#
Use the flying edges algorithm to extract the isosurface generated from the Barth sextic function.
phi = (1 + np.sqrt(5)) / 2
phi2 = phi * phi


def barth_sextic(x, y, z):
    x2 = x * x
    y2 = y * y
    z2 = z * z
    arr = (
        3 * (phi2 * x2 - y2) * (phi2 * y2 - z2) * (phi2 * z2 - x2)
        - (1 + 2 * phi) * (x2 + y2 + z2 - 1) ** 2
    )
    nan_mask = x2 + y2 + z2 > 3.1
    arr[nan_mask] = np.nan
    return arr


# create a uniform grid to sample the function with
n = 100
k = 2.0
x_min, y_min, z_min = -k, -k, -k
grid = pv.ImageData(
    dimensions=(n, n, n),
    spacing=(abs(x_min) / n * 2, abs(y_min) / n * 2, abs(z_min) / n * 2),
    origin=(x_min, y_min, z_min),
)
x, y, z = grid.points.T

# sample and plot
values = barth_sextic(x, y, z)
mesh = grid.contour([0], values, method='flying_edges')
dist = np.linalg.norm(mesh.points, axis=1)
mesh.plot(scalars=dist, smooth_shading=True, specular=1, cmap="plasma", show_scalar_bar=False)

Animate Barth Sextic#
Show 20 frames of various isocurves extracted from the Barth sextic function.
def angle_to_range(angle):
    return -2 * np.sin(angle)


pl = pv.Plotter(window_size=[800, 800], off_screen=True)

pl.open_gif('barth_sextic.gif')

for angle in np.linspace(0, np.pi, 20, endpoint=False):
    # clear the plotter before adding each frame's mesh
    pl.clear()
    pl.enable_lightkit()
    mesh = grid.contour([angle_to_range(angle)], values, method='flying_edges')
    dist = np.linalg.norm(mesh.points, axis=1)
    pl.add_mesh(
        mesh,
        scalars=dist,
        smooth_shading=True,
        specular=1,
        rng=[0.5, 1.5],
        cmap="plasma",
        show_scalar_bar=False,
    )
    pl.write_frame()

pl.close()

Total running time of the script: (0 minutes 7.921 seconds)